
Interactive storytelling
-
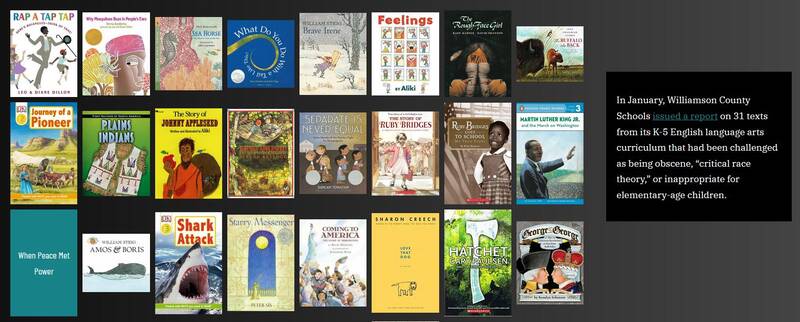
How the age-appropriate debate is altering curriculum in Tennessee
Working with data reporter Kae Petrin and reporter Marta W. Aldrich in our Tennessee bureau, we created an opening data visualization to help readers understand what books were being challenged in Williamson County — and why. Ultimately, our goal was to go beyond simply quoting the rhetoric used in the censorship debate, and to focus on the actual actions being taken. You can read more about our process in Petrin's blog post about the project.
-
The Joy Generator
NPR's science desk had a simple goal: to tell stories that would talk about the science of joy: what makes us happy, and why. To achieve that goal, the News Apps team built an interactive, mobile-first experience that combined audio, video, animation, and interactive art, split into bite-sized chapters. You can read more on the technical implementation (and the many browser bugs we conquered) in this post from myself and Connie Jin.
-
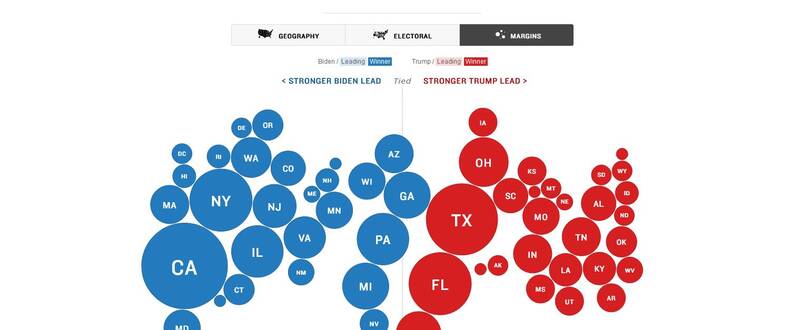
NPR's 2020 election coverage
2020's elections were not like any before. NPR covered primaries for the first time, which meant building a completely new rig for the data pipeline and displays (I wrote about its development on the team blog). I also led the rebuild of our general elections tech using the primary pipeline as a starting point and adding Preact for a single-page app on the front-end. Our results were among the fastest in the country, and we also took care to address concerns around voting by mail, misinformation about results, and the role of the electoral college. Developer Ruth Talbot wrote more about that in a retrospective blog post.
-
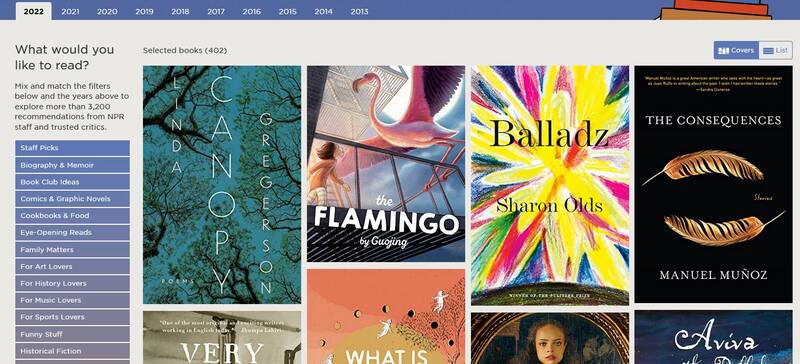
NPR Book Concierge
Started in 2013, the NPR Book Concierge has become a well-loved tradition. For 2019, I rewrote the architecture of the app in order to support the full archives — more than 2,000 books — in a single, flexible page. Read more about how I did it on the NPR News Apps blog.
-
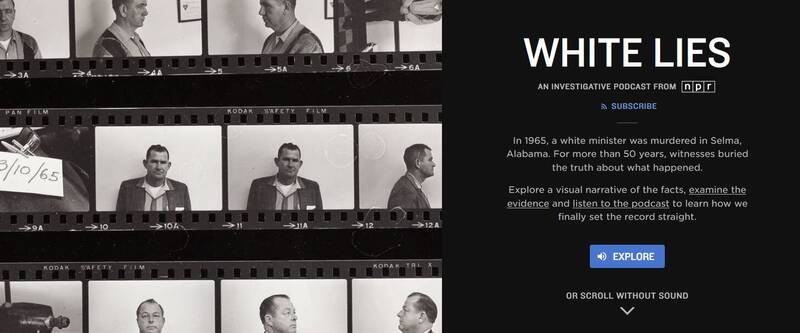
White Lies
A premiere history and true-crime podcast from NPR, I worked with a multidisciplinary team to create the newsroom's first scrolling experience. With this interactive page, we hoped to intrigue listeners, but also create a resource that they could return to throughout the season. More details on how we wrangled audio and video for the story on the team blog.
-
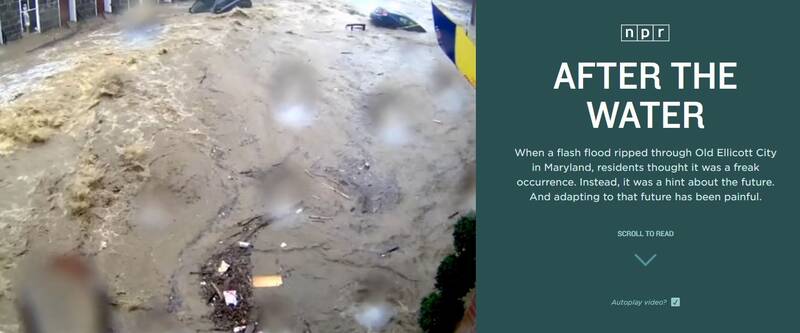
After the Flood
The floods that overtook downtown Ellicott City, Maryland, are a vivid demonstration of not only climate change's physical effects, but also the political and emotional struggles. Drawing on images and reporting from Ryan Kellman and Becky Hersher, I helped organize and build this scrolling experience, including a compelling presentation of security cam footage from the flood. More details from the development are available here.
-
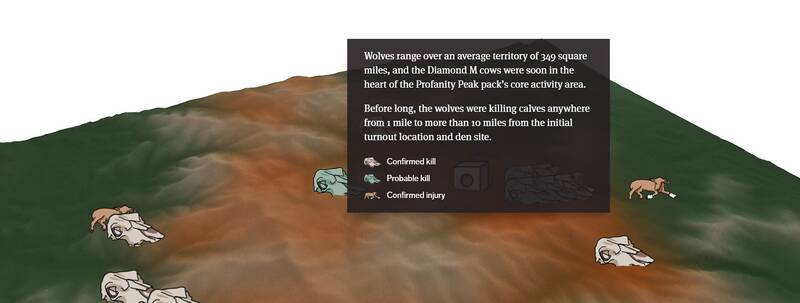
The Profanity Peak Wolves
Not only did they have one of the great trivia team names of all time, the Profanity Peak wolves were part of a Washington success story: wolves have mounted a successful comeback since being hunted almost to extension in the 1900's. But the story doesn't end so well for this pack—in this story, reported by Lynda V. Mapes, I downloaded DEM files, reverse-engineered reports from the Washington Department of Fish and Wildlife, and built a hand-rolled WebGL renderer to bring readers into the wolves' territory. A fuller write-up of my process is available on the Seattle Times developer blog.
Tools and software
-
Dailygraphics Next
The Dailygraphics rig at NPR is a long-standing tool for creating dataviz from Google Sheets and D3. Originally based on Python, this project was a from-scratch rewrite in Node that preserved the workflow of the tool, but modernized its UI, JavaScript build process, and cross-platform support. It's used by stations and newsrooms across the country.
-
Caret
In 2013, I bought a Chromebook and was shocked to discover that there wasn't a good offline text editor available for Chrome OS, so I built one myself. Caret is a full-strength tabbed text editor built around the Ace editing component, featuring fully-configurable menus and keybindings, open file memory, a command/go-to palette, and more. It had almost half a million users and was one of the best editors available on the platform, used in classrooms and by professional developers around the world until Google killed Chrome Apps for "lack of interest."
-
Tarot
As long as social networks privilege posts that have image content attached, either through page metadata or explicit uploads, newsrooms will need a way to generate visual versions of text stories. Tarot is in a long tradition of quote card generators, but written to be more flexible and easier to maintain through web components and canvas rendering. You can read more about its design in a post on the Chalkbeat blog.
-
Betty
Many newsrooms use ArchieML, a lightweight markup language, to make it easier for reporters to author content for interactive pages. The original parser is built on top of regex and is difficult to extend, so I wrote Betty as a real three-stage parser that adds hooks for object assembly and a new, less-fragile syntax for multiline strings.
Speaking
-
Visualization as a Civil Right
Riffing off Marcy Sutton's Accessibility is a Civil Right, this session set out to gather new strategies and best practices for creating accessible news visualizations. Attendees were taught how to use a mobile screen reader and given a chance to discover common mistakes by test driving their own projects.
[slides] [notes] [transcript]Hacks and Hackers
How do news teams create interesting, interactive storytelling on a deadline, without technical support or funding? The answers are in this talk, which breaks down the Seattle Times news app template, dissects our Google Apps Script strategy, and makes a passionate case for the web as the only future of digital journalism.
[video] [slides]Custom Elements in Production
In this talk, I gave an overview of our successful use of custom elements and web components at the Seattle Times, and provided some rules of thumb for others who might be considering this exciting and intuitive new technique. Although the technology has changed since then, with the introduction of the V1 spec and widespread adoption, I'm proud to have been ahead of the curve.
[video] [slides]Designing News Apps for Humanity
Increasingly relevant as we build news sites that are more customized, more dependent on third-party code, and more automated, this SRCCON session examined the dangers of algorithmic design as it applied to journalism. Inspired by Eric Meyer and Sarah Wachter-Boettcher's Design for Real Life, participants talked about how we've tried to safeguard readers, and how we've failed.
[slides] [notes]Longform writing
-
They're not database rows; they're people
Data journalism has long prioritized transparency over harm prevention. In this piece, I argue that we should be thinking more carefully about how we use and release personal information in our reporting, instead of treating that data as either a revenue source or simply the "cost of doing business."
-
Web Components at Work
A short guidebook based on my experiences with writing and publishing web components at NPR, this text aims to introduce the concepts behind the tech, and present patterns that can make them more sustainable and conceptually coherent.
-
It's time to rethink how we report election results
After covering 2020, a lot of my experience with elections — up to that point, a significant part of my career and skillset — began to crystallize into a more coherent and critical perspective. In this piece for Source, I attempt to lay out guidelines that newsroom data teams can consider in order to prioritize the health of democracy over the horse race.
-
The Elegant Selection
As the web platform has become increasingly capable, the tools we rely on for interactive and visual storytelling can be trimmed and in some cases eliminated. I wrote this free e-book to collect the strategies that I used at the Seattle Times to create lighter, faster, more efficient data journalism.